



Count, color the graph, then read it
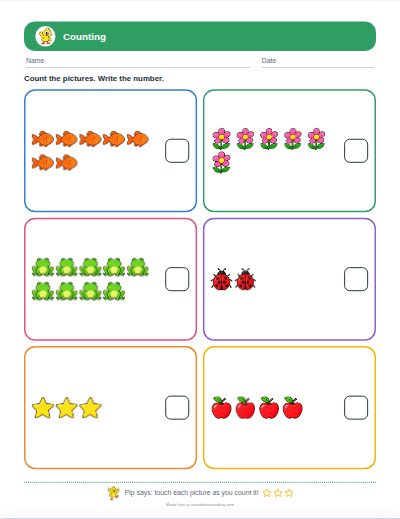
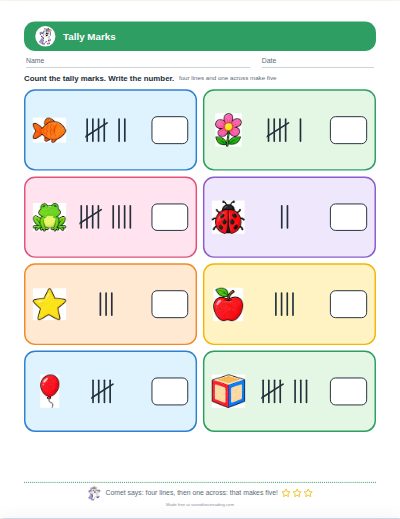
Make a graphing worksheet for kindergarten. On the first kind of page your child counts each kind of picture and colors one box in the bar graph for each one, then circles the one with the most. On the second kind the graph is already colored: your child reads it and writes how many of each there are.
Your worksheet:
A graph turns counting into a picture. Children compare the bars and see at a glance which is more and which is fewer, which is the start of reading data.
Show your child how to cross out each picture as it is counted and color one box for it. Then count the colored boxes to check.
No. Every bar on a page has a different number, so “the most” and “the fewest” always have one answer.
Yes. Turn on “Answer key page”.
Yes. Choose “Black and white” under “Print in”. The page uses very little ink.
Yes, with no sign-up and no limit.
No maker matches that yet. Clear the box to see them all.
The packs on this site are free. The One Sheet goes further: one sheet a day, made for your child from what you tell us happened.
See The One Sheet · $9.99 a month
Or get the Complete Kindergarten Bundle: 26 packs in one download for $3Is reading hard for your child? Find where to start